IPSS-R Prognostic Values
Cytogenetics
CYTOGENETICS
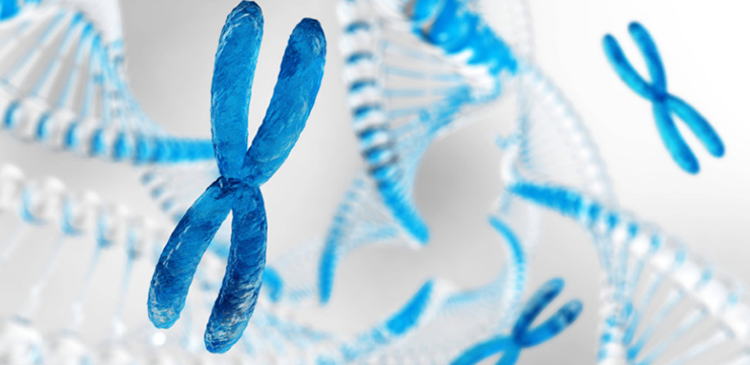
Cytogenetics is the study of the structure and function of the chromosomes. Long strings of DNA are coiled up with proteins to form the chromosomes. A chromosome abnormality is a missing, extra, or irregular portion of chromosomal DNA.[1] These can occur in the form of numerical abnormalities, where there is an atypical number of chromosomes, or as structural abnormalities, where one or more individual chromosomes are altered.
Certain cytogenetic changes are considered favorable, while others are considered less favorable. Some cytogenetic abnormalities are associated with a more favorable response to certain treatments, such as del(5q). MDS patients with del(5q) have been shown to respond more favorably to Lenalidomide (Revlimid®). The cytogenetic report will describe the number of cell divisions (usually 20), the number of normal chromosomes, and any chromosomes that are abnormal. The number of cell divisions (metaphases) is represented in brackets [ ].
The IPSS-R score is based, in part, on a revised grouping of cytogenetic abnormalities:
| Cytogenetic Risk Group | Cytogenetic Abnormalities |
|---|---|
| Very Good | del(11q), -Y |
| Good | Normal, del(5q), del(12p), del(20q), double including del(5q) |
| Intermediate | del(7q), +8, +19, i(17q), any other single or double independent clones |
| Poor | -7, inv(3)/t(3q)/del(3q). double including -7/del(7q) Complex: 3 abnormalities |
| Very Poor | Complex: >3 abnormalities |
Cytogenetic abnormalities are present in approximately 40% of all cases of primary MDS, and in the majority of cases of secondary MDS. Cytogenetics play a very important role in estimating prognosis for a patient with MDS. The changes are described based on the actual structural changes seen when evaluating the chromosomes. Cytogenetics is only one of the five prognostic values for determining your risk score.
| Value/Score | 0 | 0.5 | 1 | 1.5 | 2 | 3 | 4 |
|---|---|---|---|---|---|---|---|
| Cytogenetics Risk Group | Very Good | Good | Intermediate | Poor | Very Poor | ||
| Blasts (%) | <2% | >2%-<5% | 5-10% | >10% | |||
| Hemoglobin (g/dL) | >10 | 8-<10 | <8 | ||||
| Platelets | >100,000 | 50,000-<100,000 | <50,000 | ||||
| ANC | >0.8 | <0.8 |
[1] reference – NHGRI. 2006. Chromosome AbnormalitiesArchived 2006-09-25 at the Wayback Machine


